Track Real-Time Progress with Planera’s Project Dashboard
A central hub that offers a high-level overview of key project metrics, allowing you to seamlessly monitor and analyze progress, performance and resource allocation.
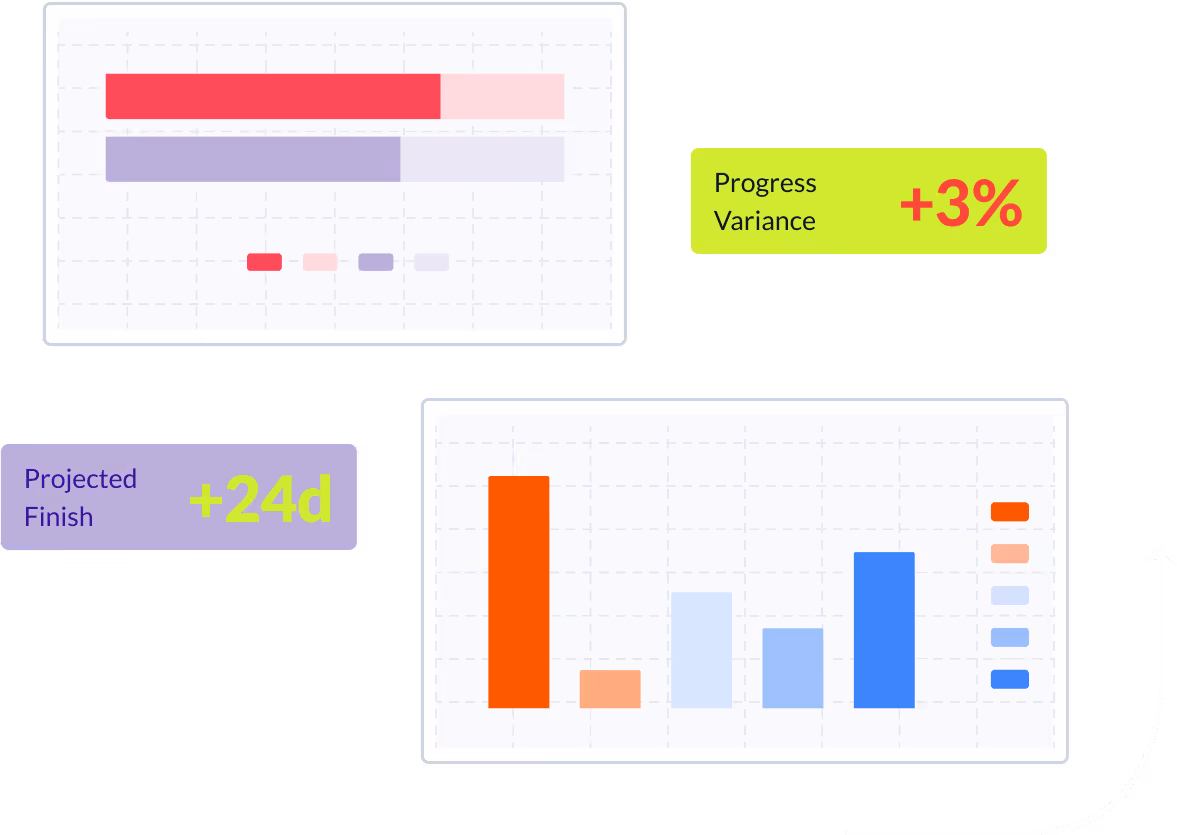
Performance Comparison
and Risk Identification
Planera allows you to easily compare project baseline metrics against current construction project performance, identify potential risks and track progress through intuitive charts, graphs and progress curves.

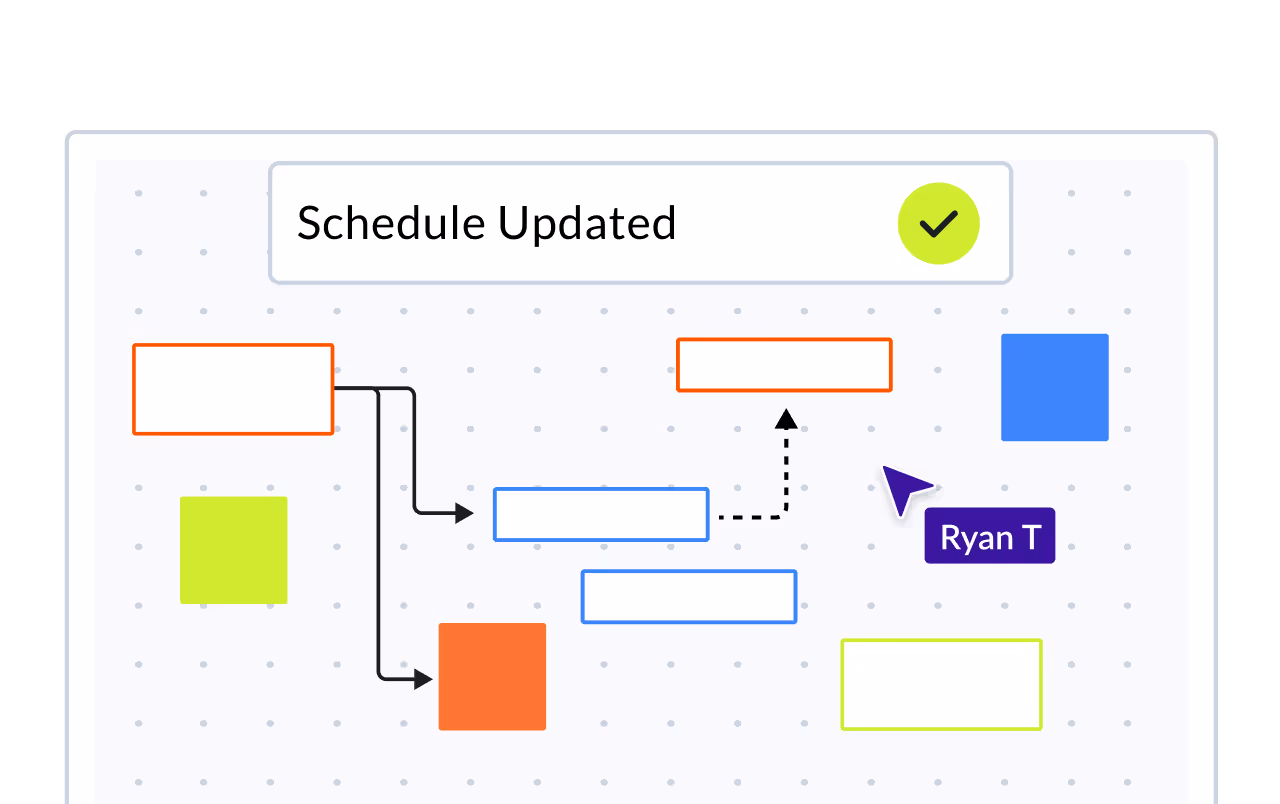
Monitor Status Updates and Key Project Metrics and KPIs
Get a real-time snapshot of various aspects such as schedule adherence, project status, and critical path health, all tailored to facilitate optimal project management.
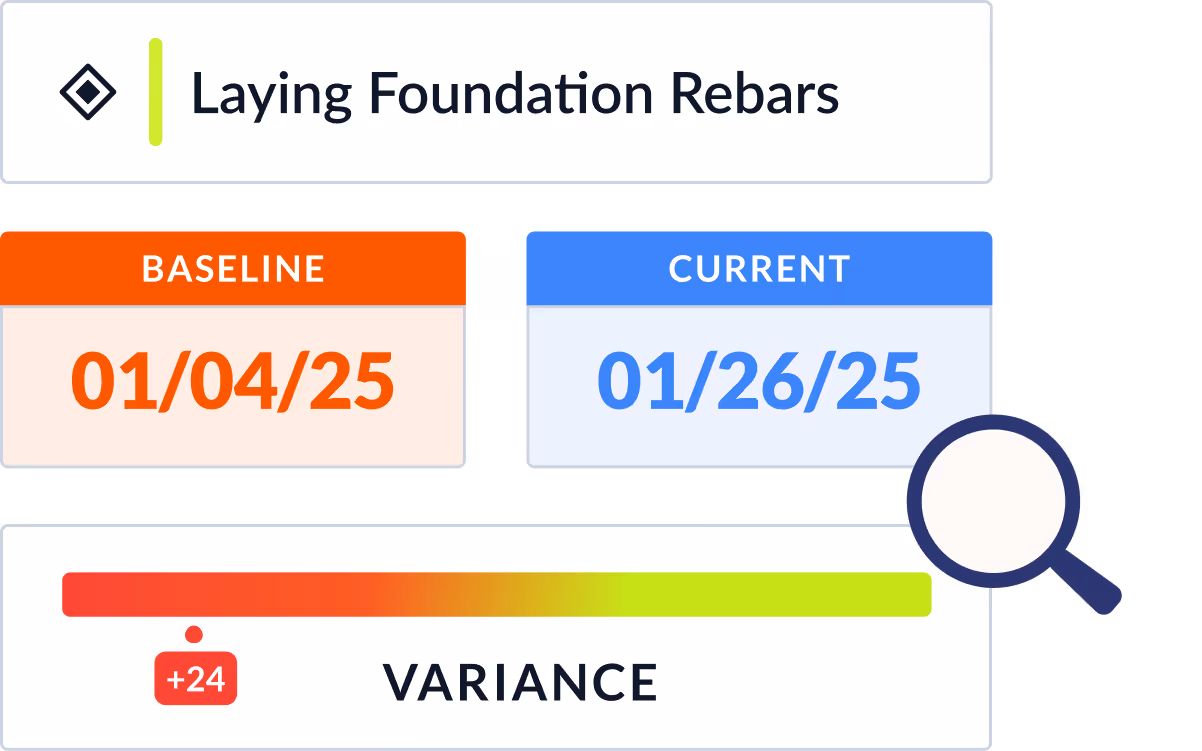
Track Important Dates
Set up a customizable watchlist to monitor and prioritize crucial dates in your project, including milestones, groups, and individual activities. Stay informed and keep track of key events throughout the project lifecycle.
Frequently Asked Questions
To help you make an informed decision, we've compiled some of the most commonly asked questions.
What should a construction project dashboard track?
A good construction dashboard should track schedule health (critical path status, float trends, milestone progress), schedule quality scores (DCMA metrics), resource utilization, percent complete vs. planned, and key variances. Planera's project dashboard gives you all of this in a centralized view connected to your live CPM schedule, so the numbers are always current.
How does Planera's project dashboard connect to the CPM schedule?
Unlike standalone BI dashboards that require manual data exports, Planera's dashboard reads directly from your live schedule network. When activities are updated, the dashboard reflects the change immediately, including critical path shifts, float changes, and milestone status. There's no lag between the schedule and the reporting layer.
Can I track multiple construction projects in one dashboard?
Yes. Planera's enterprise dashboard provides portfolio-level visibility across all your projects. You can compare schedule health, resource allocation, and progress metrics across your entire book of work, making it easier to spot which projects need attention and where to reallocate resources.
What schedule KPIs should construction teams monitor?
Key schedule KPIs include: percent planned complete vs. actual, critical path length changes, total float trends, number of activities with negative float, DCMA quality scores, milestone variance, and planned percent complete (PPC) for lean tracking. Planera tracks all of these automatically and surfaces them in the dashboard without manual calculation.
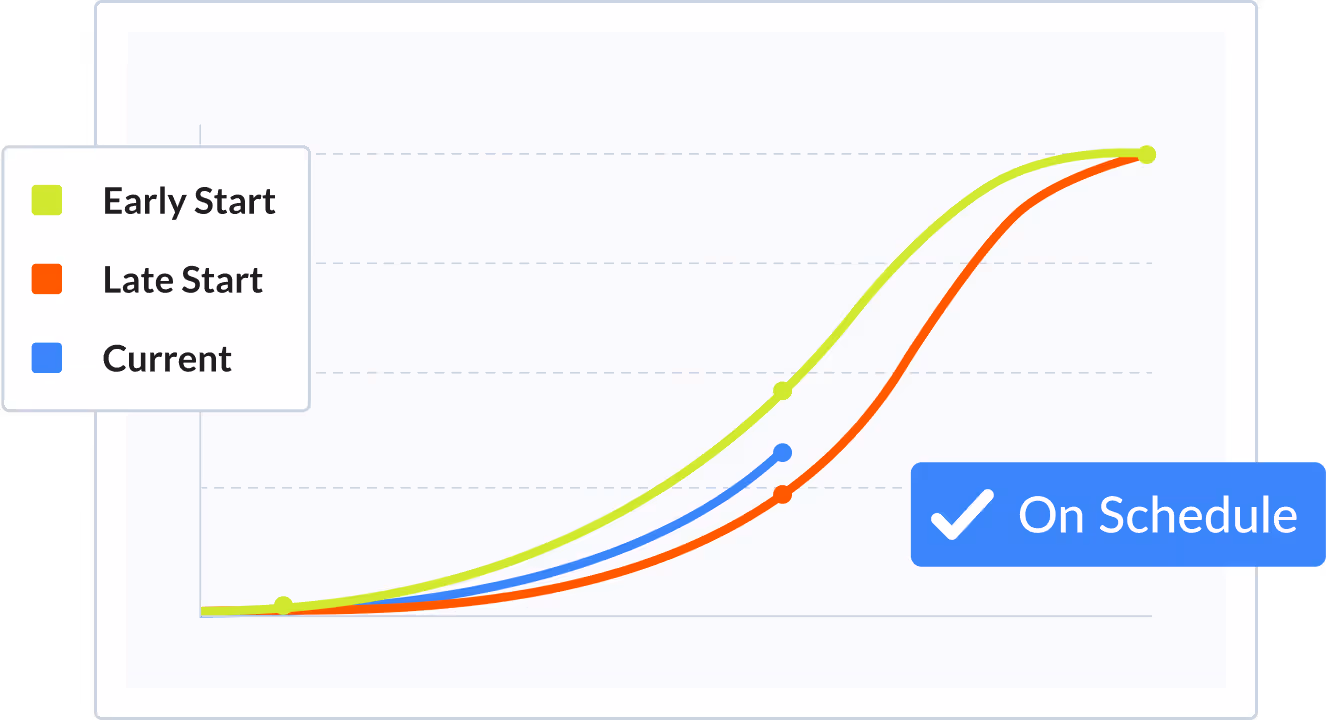
How do S-curves and progress tracking work in Planera?
Planera generates progress S-curves from your CPM schedule data, plotting planned vs. actual completion over time. You can see at a glance whether your project is ahead, on track, or falling behind the baseline. Combined with PPC tracking and variance codes, this gives project leaders a complete picture of schedule performance.