Most construction projects don’t fail overnight, they slip slowly, one missed handoff or delayed task at a time, until budgets stretch and deadlines move.
The underlying issue is usually the same. Poor schedule planning and limited visibility. When we can’t clearly see what needs to happen and when, small problems go unnoticed until they become expensive ones.
Construction Gantt charts help us solve this by turning complex schedules into clear, visual timelines. They show tasks, durations, and dependencies in one place, which helps our teams spot risks early and stay aligned from planning through execution.
In this guide, we’ll walk through how to read a Gantt chart with confidence, apply it to real construction schedules, and avoid the common mistakes that cause timelines to fall apart.
What is a Construction Schedule Gantt Chart?
A construction schedule Gantt chart is a visual way to map out a project timeline by using horizontal bars. Here, each bar represents a specific task, and shows when the project starts, when it finishes, and how long it’s expected to take. When we stack all those tasks together, we get a clear picture of the entire construction schedule, from start to final inspection.
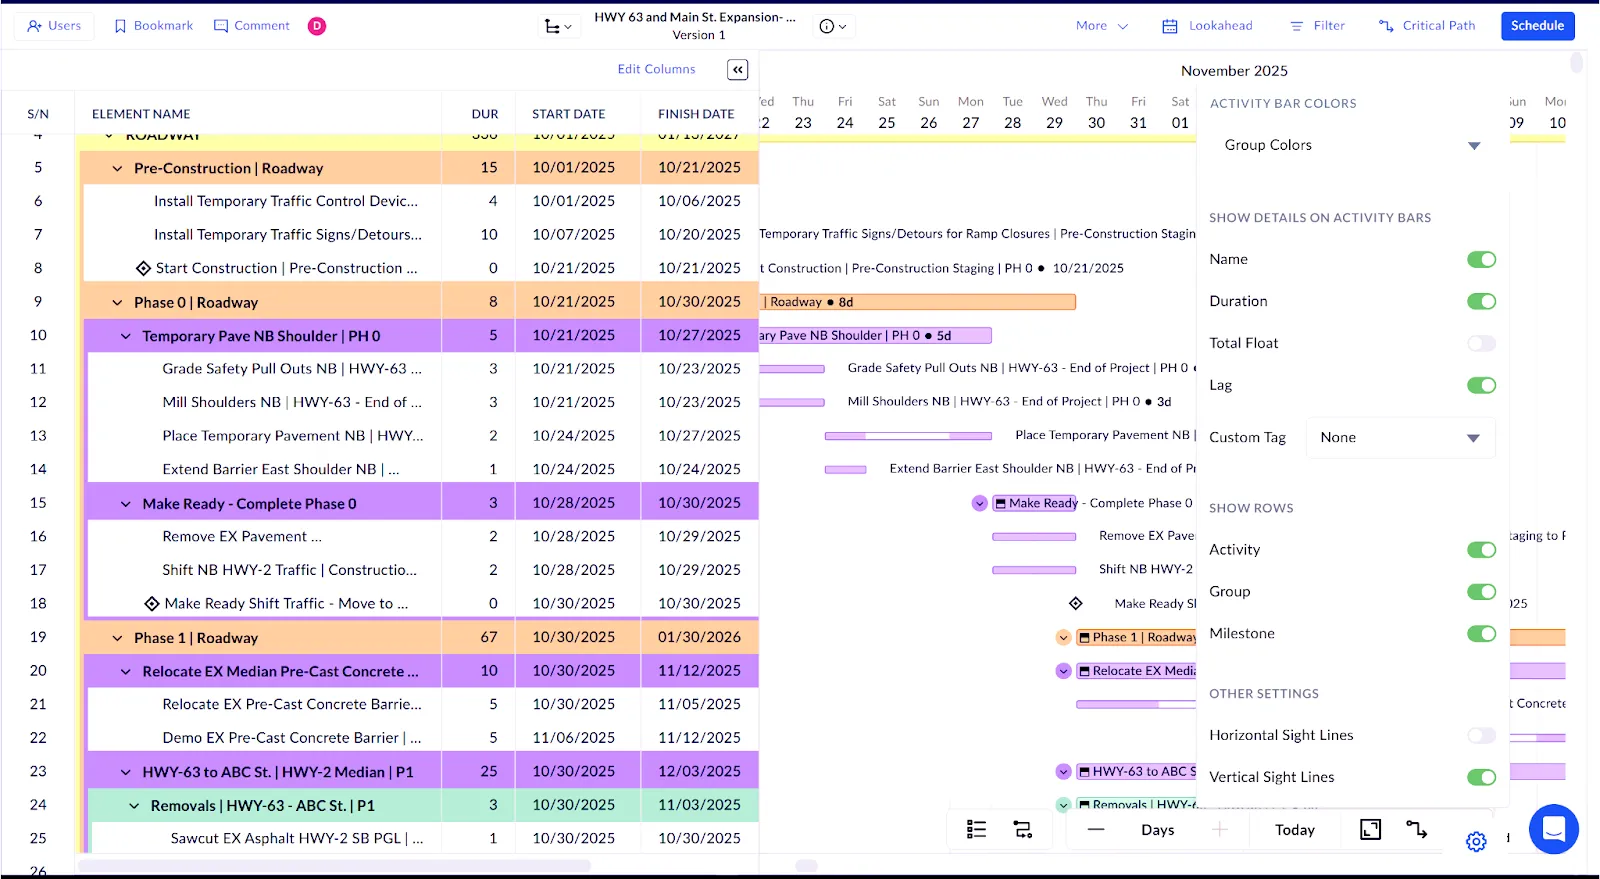
Mainly, a Gantt chart helps us see how work is sequenced. It shows task durations and how activities depend on one another. Beyond basic scheduling, many teams also use Gantt charts to support budgeting, material planning, and progress tracking. In Planera, you can display activity names, durations, total float, and even a custom tag alongside each task to make schedules more informative and easy to read.
The chart gets its name from Henry Gantt, a mechanical engineer who developed this visual approach in the early 1900s. He wanted supervisors to quickly see whether work was on track or falling behind, without digging through complex reports.
Fun fact about chart history. A Polish engineer named Karol Adamiecki created a similar scheduling chart even earlier and called it a harmonogram. His method significantly improved productivity in industrial settings, but because his work was published only in Polish, it never gained international recognition at the time.
So later, construction teams adopted Gantt charts, especially for large, complex projects where timing and coordination mattered most. Major infrastructure efforts relied on them to manage tight schedules, shared resources, and costly delay penalties. That early success is a big reason the method stuck.
Today, Gantt charts remain one of the most widely used construction scheduling tools. With modern construction management software platforms handling updates and dependencies, they’re easier to use, easier to share, and far more powerful than their early paper-based versions.
Why Construction Projects Need Gantt Charts
The construction industry has a scheduling problem. According to Contimod, 35% of construction professionals' time goes toward non-productive activities. The average project slippage runs 20 months behind the original schedule.
Think about that. Twenty months. That's not a minor delay. That's the difference between profitable and painful.
To tackle this, using tools like construction workflow management software can help simplify operations and prevent delays.
Engineering, Technology & Applied Science Research found that design changes contribute to 56.5% of cost overruns and 40% of project delays. Planning errors account for 34.5% of cost overruns and 23.1% of delays. These are preventable problems that start with poor scheduling practices.
The financial impact is real. According to Rabbet, the U.S. construction industry reached $280 billion in costs directly tied to slow payments in 2024. And 82% of contractors now face payment delays stretching over 30 days, up from 49% just two years ago.
Gantt charts address these problems in several ways:
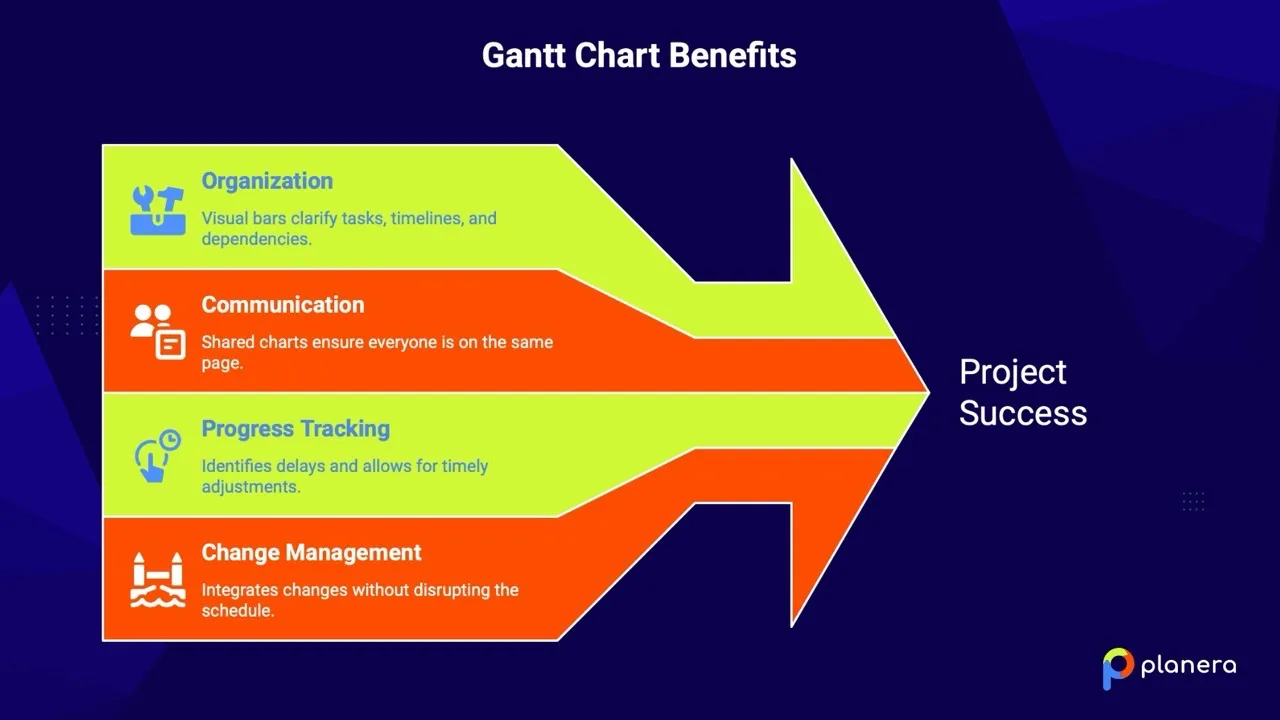
- Organization and clarity: They turn an overwhelming project into visual bars that show each task, its timeline, and its dependencies. You can see at a glance which activities need attention, which can slide, and which require immediate action.
- Better communication: Contractors can share Gantt charts with clients to show project progress. Subcontractors can see how their work connects to other trades. Everyone works from the same source of truth.
- Progress tracking: When one part of the project slips, the Gantt chart shows which subsequent tasks get affected. You can make adjustments before small delays become big problems.
- Change management: Weather delays, design changes, permitting issues. Construction projects face constant disruption. Gantt charts give you a framework to evaluate the impact of changes and integrate them into the schedule without losing control.
What Are the Key Components of a Construction Gantt Chart?
Before you can use a Gantt chart effectively, you need to understand what you're looking at. Here are the building blocks of every construction schedule Gantt chart.
1. Taskbars
These are the horizontal bars that represent each activity in your project. According to Vaia, the length of each bar shows the task duration, while its position on the timeline shows start and end dates.
For example, a "Foundation Pouring" bar can stretch 5 days starting on Day 15 of your project. A "Framing" bar may run 14 days starting on Day 25. The bars give you instant visual feedback on how long things take and when they happen. Planera color-codes taskbars by trade or phase and lets you expand or collapse grouped activities, so you can quickly focus on the parts of the project that matter most.
2. Timeline
The horizontal axis at the top or bottom of your chart represents time. This can show days, weeks, or months depending on your project scale. A three-week renovation can be displayed in days. A two-year hospital project may show weeks or months.
3. Milestones
Look for diamond shapes scattered throughout the chart. We can describe milestones as significant events or points in the project. They represent key stages and work great for tracking progress.
Common construction milestones include "Site Prep Complete," "Foundation Inspection Passed," "Building Dried In," and "Certificate of Occupancy." These are your checkpoints that confirm you're on track.
4. Dependencies
Here, you’re looking at the arrows connecting taskbars that show relationships between activities. Arrows reflect the direction of the dependency, with the base coming from the predecessor (the task that needs to finish first) and pointing toward the successor (the task that can only start after).
Construction is full of dependencies. You can't frame until the foundation cures. You can't hang drywall until rough-in inspections pass. You can't paint until the drywall is finished. Dependencies show these relationships visually, so nothing gets scheduled out of sequence.
When a dependency changes in Planera, the schedule updates automatically, ensuring all downstream tasks reflect the new plan without manual adjustments.
5. Start and Finish Dates
Every task has a planned start date and finish date. These dates are the backbone of the Gantt chart. Accurate dates keep your schedule realistic and help everyone know when they need to show up.
6. Resource Allocation
Many Gantt charts include information about who or what is assigned to each task. Gleek notes that this provides a clear overview of resource distribution throughout the project. You can see if you've overloaded certain crews or left equipment sitting idle. Planera highlights resource conflicts and allows you to adjust assignments directly within the Gantt chart, helping prevent bottlenecks before they occur.
7. The Critical Path
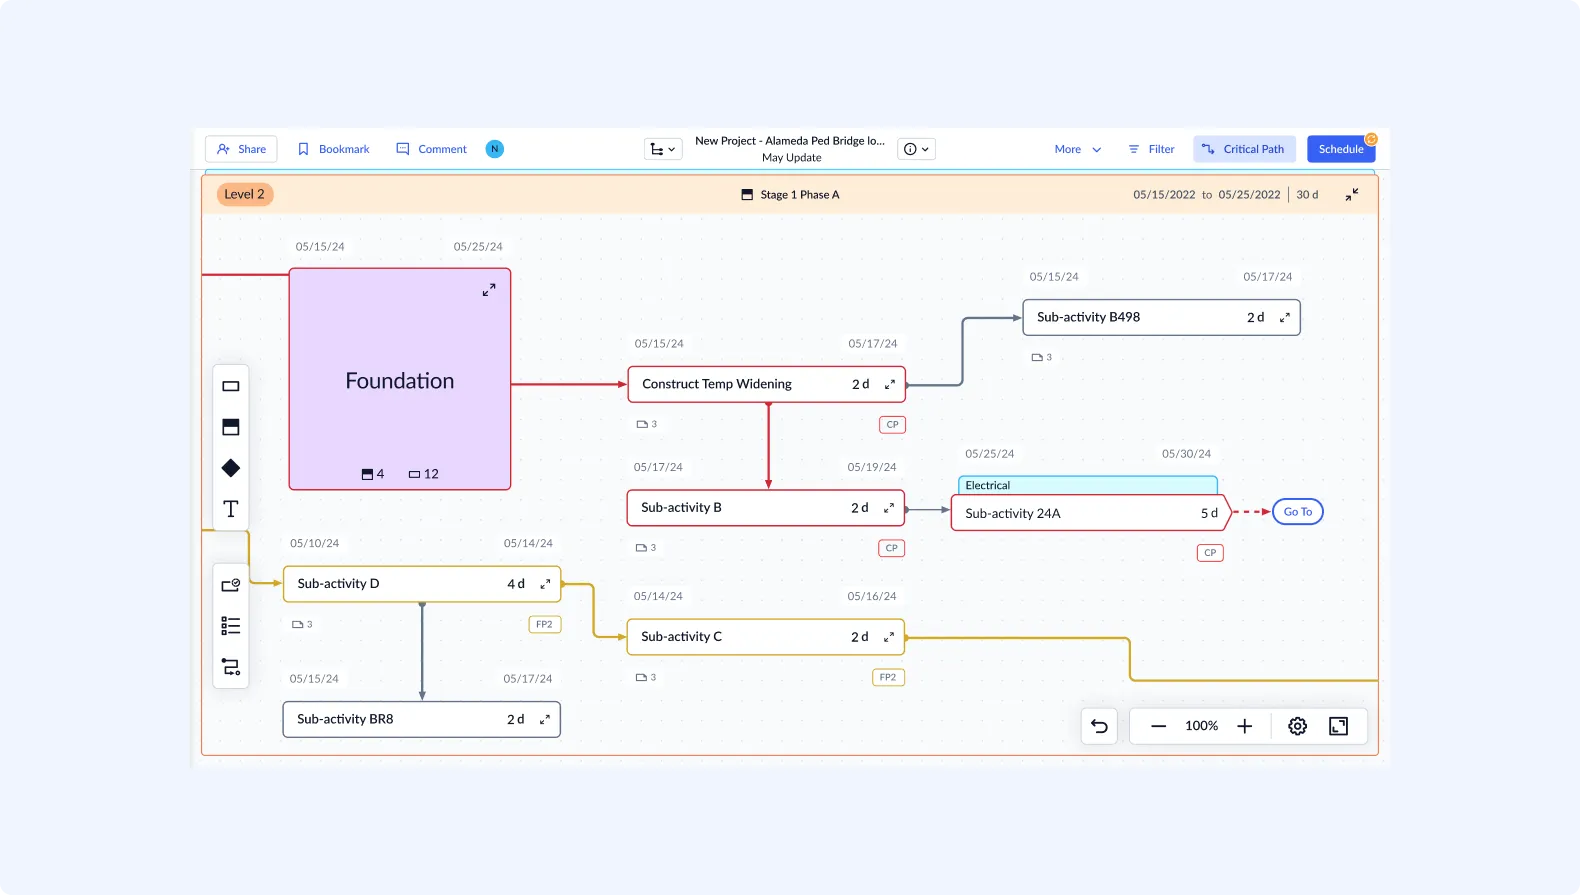
This is the sequence of dependent tasks that determines your project completion date. GanttPRO explains that the critical path represents the longest chain of dependent tasks. If any task on this path gets delayed, your entire project gets delayed.
Most modern construction management software highlights critical path tasks in a distinct way. In Planera, you can toggle the critical path on or off directly in the Gantt view, making it easy to focus on the activities that control the project’s end date. This visual emphasis helps teams quickly identify which tasks demand the closest attention.
How to Read a Construction Gantt Chart: A Step-by-Step Guide
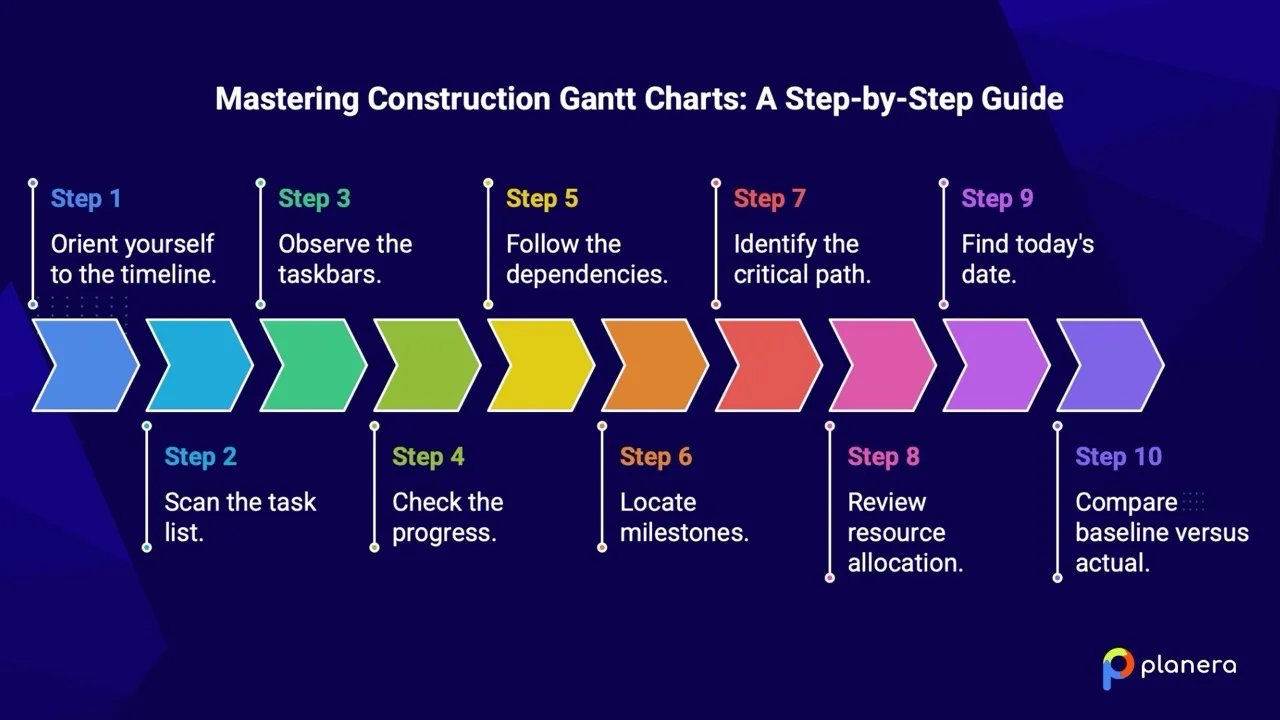
Looking at a construction schedule Gantt chart for the first time can feel overwhelming. All those bars, arrows, and colors. Where do you even start?
Here's a practical walkthrough to read any Gantt chart like a pro:
Step 1: Orient yourself to the timeline.
Look at the horizontal axis first. Is it showing days, weeks, or months? What's the total project duration? Get your bearings on the time scale before anything else.
Step 2: Scan the task list.
The vertical list on the left side shows all project activities. These are usually grouped by phase. Look for headers like "Pre-Construction," "Foundation," "Framing," or "Finishes" that organize related tasks together.
Step 3: Observe the taskbars.
Now look at the main chart area. Which tasks have already been completed (usually shown with shading or different coloring)? Which are in progress? Which are coming up? Get a sense of where the project stands.
Step 4: Check the progress.
Many Gantt charts show percentage completion within each bar. A bar can be half-filled, showing 50% complete. Compare this to the current date line to see if you're ahead or behind.
Step 5: Follow the dependencies.
Trace the arrows between tasks. Understand which activities feed into others. This helps you anticipate bottlenecks and see why certain tasks can't start yet.
Step 6: Locate milestones.
Find the diamond shapes marking key checkpoints. These tell you when major phases should be completed and help you track progress against important goals.
Step 7: Identify the critical path.
Look for the highlighted tasks (often red or orange) that form the longest chain of dependent activities. These are the tasks that control your project's end date.
Step 8: Review resource allocation.
If your chart shows resource assignments, check who's working on what. Look for overloaded crews or scheduling conflicts.
Step 9: Find today's date. Most Gantt charts include a vertical line showing the current date. This helps you compare planned progress versus actual progress at a glance.
Step 10: Compare baseline versus actual.
If your chart includes a baseline schedule, compare where you planned to be against where you actually are. This variance analysis reveals whether you're truly on track.
Quick Reading Tips:
- Start with the big picture before zooming into details
- Look for tasks that are behind schedule first
- Check critical path tasks daily during active phases
- Use color coding to quickly identify status
- Read from left to right, like a timeline of events
How to Create a Construction Schedule Gantt Chart?
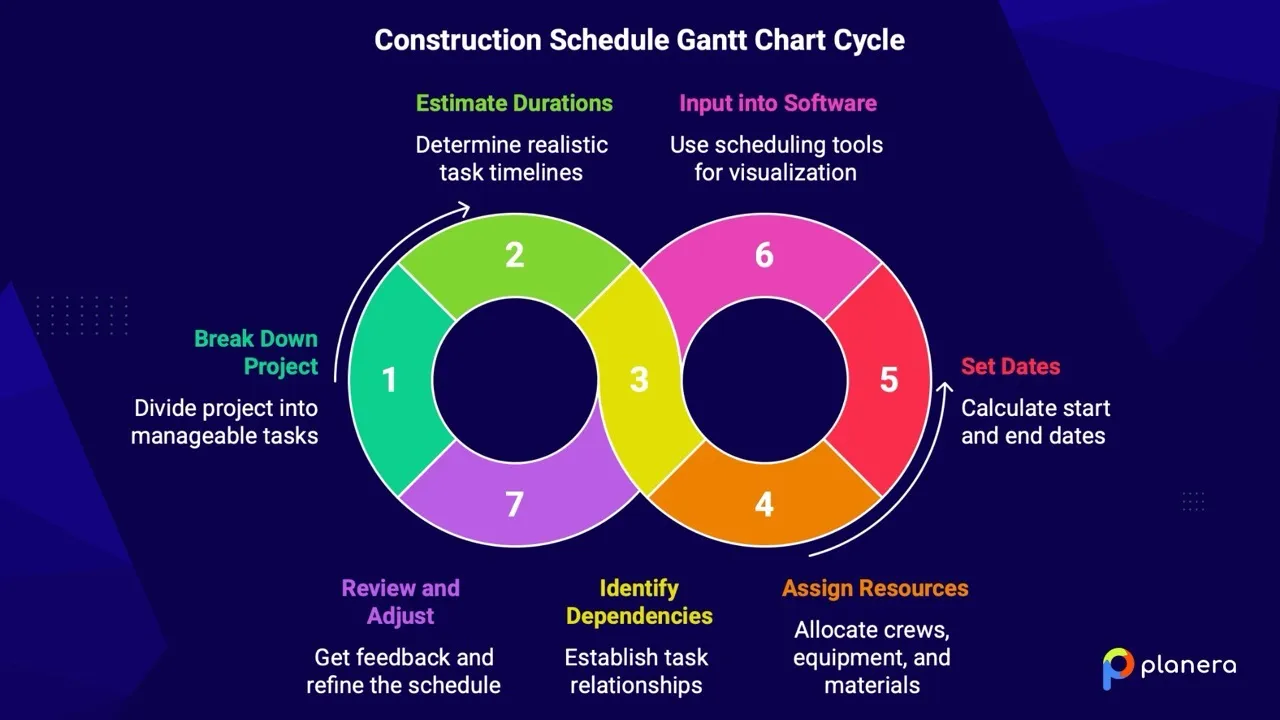
Here's how to build a construction schedule Gantt chart from scratch.
1: Break Down Your Project into Tasks
Start by listing every activity your project requires, from site preparation to final inspections. Use a Work Breakdown Structure (WBS) approach: organize major phases, then break each phase into detailed tasks. Typical phases might include:
- Pre-construction (permits, mobilization, surveying)
- Site work (clearing, grading, utilities)
- Foundation (excavation, forming, pouring, curing)
- Framing (floor, walls, roof)
- MEP rough-in (mechanical, electrical, plumbing)
- Exterior (roofing, siding, windows)
- Interior finishes (drywall, painting, flooring)
- Closeout (punch list, inspections, commissioning)
In Planera, you can group related tasks under phase headers and collapse or expand them in the Gantt view for a clear overview.
2: Estimate Task Durations
For each task, determine how long it will take. Be realistic based on your crew size, equipment availability, and project conditions.
Consider historical data from similar projects. If framing took 12 days on your last commercial build of a similar size, use that as your starting point. Factor in any differences that will speed things up or slow things down.
Allow some flexibility for unexpected delays, because a schedule with zero buffer is a schedule that will fail.
3: Identify Dependencies
Determine which tasks must finish before others can start. It’s important to determine which tasks depend on others.
Common construction dependencies include:
- Foundation must cure before framing starts
- Framing inspection must pass before MEP rough-in
- Rough-in inspection must pass before insulation
- Drywall must be finished before painting
- Flooring comes after painting in most cases
The most common dependency type is finish-to-start: Task B can't start until Task A finishes. But there are three other types to consider:
- Start-to-Start: Task B can't start until Task A starts
- Finish-to-Finish: Task B can't finish until Task A finishes
- Start-to-Finish: Task B can't finish until Task A starts (rare in construction)
Mark, which tasks can run in parallel. Electrical and plumbing rough-in may happen simultaneously, for example. Planera supports all dependency types (finish-to-start, start-to-start, finish-to-finish, start-to-finish) and automatically updates downstream tasks when one changes.
4: Assign Resources
Identify who or what is needed for each task:
- Which crews handle which activities
- What equipment each task requires
- Material delivery timing
- Subcontractor availability
Planera allows you to assign crews, equipment, and materials to each task. The software highlights resource conflicts and lets you rebalance workloads, preventing bottlenecks before they happen.
5: Set Start and End Dates
With durations and dependencies defined, you can calculate actual dates. Work backward from your final deadline if you have a fixed completion date. Otherwise, work forward from your start date.
Enter project start dates and let Planera calculate task timelines based on durations and dependencies. You can account for non-working days, holidays, or site-specific schedules.
6: Build Your Gantt Chart in Planera
With tasks, durations, dependencies, and resources defined, Planera automatically generates your Gantt chart. You can:
- Collapse/expand activity groups
- Toggle critical path on or off
- Display total float, activity names, and custom tags
- Organize tasks by location, labor, or trade
- Switch between absolute and relative time views
- Export schedules to PDF with logos for reporting
Planera keeps your schedule live and collaborative, so field and office teams always work from the same up-to-date information. With our cloud access and construction-specific Gantt templates, you can start with a structured schedule, adjust tasks as needed, and maintain real-time updates across your team.
7: Review and Adjust
Share your draft schedule with the project team. Get input from superintendents, subcontractors, and anyone else who will execute the work.
Verify the critical path makes sense. Does the sequence reflect how construction actually happens? Are there unrealistic timelines that need adjustment?
Get stakeholder buy-in before setting your baseline. A schedule nobody believes in is a schedule nobody will follow.
What is the Critical Path in Construction Scheduling?
The critical path deserves special attention because it controls your project completion date. Every day you lose on a critical path task is a day added to your project duration.
Monday.com defines the critical path as a chain of dependent tasks that influences the finishing date of the overall project. It shows the longest duration of tasks from start to finish.
Think of it this way: Your project has many paths from beginning to end. The critical path is the longest one. You can delay tasks on shorter paths without affecting the end date, but any delay on the critical path pushes everything back.
How to Identify the Critical Path
We have outlined these steps:
- List all activities or tasks in your project
- Determine the projected duration of each task
- Identify which tasks depend on other tasks
- Determine which dependent tasks are critical (must be completed for the project to finish)
- Note any potential lag time between tasks
- Add milestones to track progress
Most modern software calculates the critical path automatically. Tasks with zero float (no scheduling flexibility) fall on the critical path.
To learn more about the best CPM software platforms in the construction industry, you can check out our guide.
What Are Some Examples of Critical Path?
For a residential construction project, the critical path can look like this:
Site Prep (5 days) → Foundation Excavation (3 days) → Foundation Pour (2 days) → Foundation Cure (7 days) → Framing (14 days) → Roof Dry-In (5 days) → Final Inspection (1 day)
Total: 37 days minimum project duration
Every other task either runs in parallel with these activities or has flexibility in its timing. But these 37 days represent the shortest possible schedule.
How to Manage the Critical Path?
Monitor critical path tasks daily during active phases. A delay here affects the entire project.
Address problems immediately. When a critical task runs behind, throw resources at it. Bring in extra crews. Work overtime. Do whatever it takes to recover the schedule.
Consider fast-tracking when safe. Sometimes you can overlap critical activities that were planned sequentially. Just make sure the overlap doesn't create safety issues or quality problems.
Communicate the critical path to everyone. When subcontractors understand which tasks control the schedule, they prioritize accordingly.
What are Some Common Mistakes When Using Construction Gantt Charts (And How to Avoid Them)?
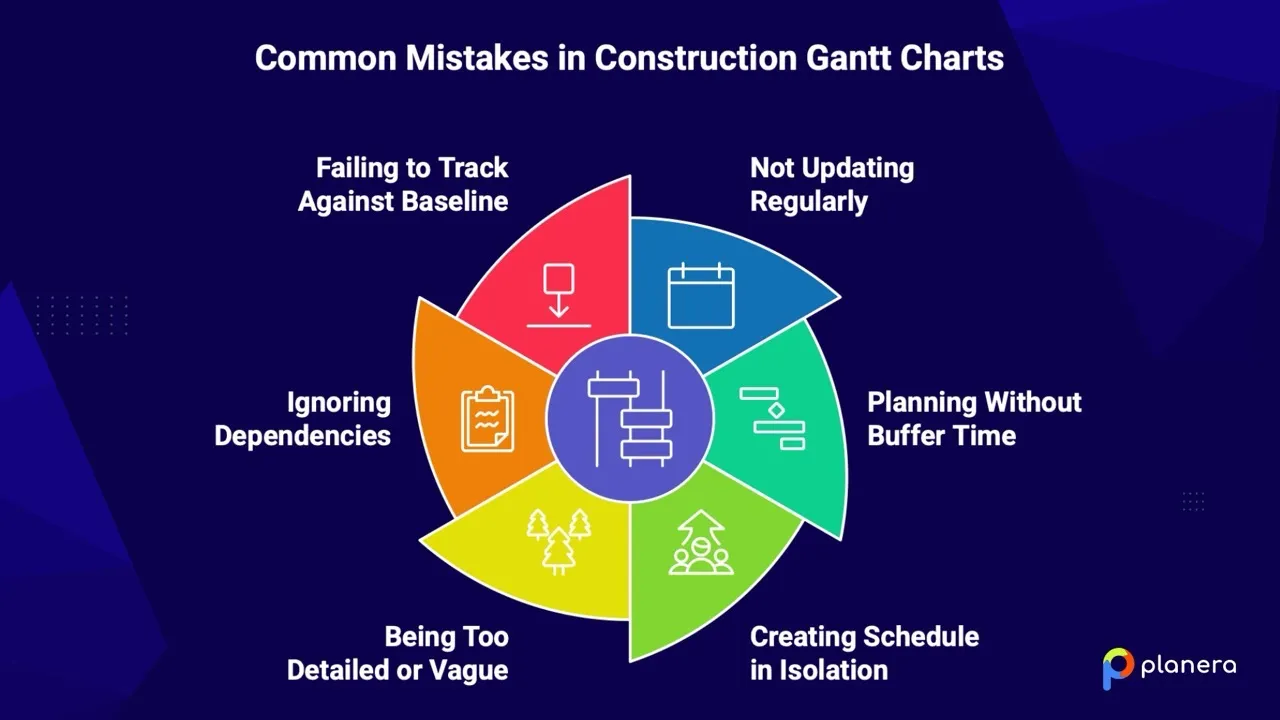
Even experienced project managers make these errors. Here's what to watch for.
Mistake 1: Not Updating Regularly
Gantt charts are only helpful if constantly updated, sometimes as regularly as daily. A schedule that doesn't reflect current reality is worse than useless. It actively misleads people.
Solution: Update your schedule at least weekly. During fast-moving phases, update daily. Post the current version on the job site so everyone sees the same information.
Mistake 2: Planning Without Buffer Time
When you plan activities back-to-back with no slack, the first delay cascades through your entire schedule. Gantt charts become useless or actively add stress when activities are planned too tightly.
Solution: Build float time into your schedule. Identify contingency periods for weather, permitting, and unexpected problems. A good rule of thumb: add 10-15% buffer to critical path activities.
Mistake 3: Creating the Schedule in Isolation
Not involving the project team in schedule creation is a common mistake. You'll miss important details that only the people doing the work understand.
Solution: Involve team members in the planning phase. Get input from foremen, subcontractors, and field supervisors. They know how long things actually take and what dependencies exist that aren’t obvious.
Mistake 4: Being Too Detailed or Too Vague
A schedule with 2,000 line items is impossible to maintain. A schedule with 10 line items doesn't provide enough guidance. Either extreme creates problems.
Solution: Find the right level of detail. Focus on major phases, key tasks, and important milestones. We advise keeping schedules detailed enough to guide the work but not so granular they become hard to maintain.
Mistake 5: Ignoring Dependencies
When tasks aren't properly linked, your schedule shows activities that can't actually happen in that sequence. Field teams know it's wrong and stop trusting the schedule.
Solution: Map out dependencies carefully. Validate them with people who do the work. Test your logic by asking: "Can this task really start before that one finishes?"
Mistake 6: Failing to Track Against Baseline
Without a baseline, you can't measure performance or learn from variances. You don't know if you're ahead or behind because you never established what "on time" means.
Solution: Set a baseline at project start. Compare actual progress against planned progress throughout the project. Use variance analysis to improve future estimates.
Quick Checklist: Is Your Gantt Chart Effective?
- Does it reflect the current project status?
- Can everyone on the team access it?
- Does it show the critical path clearly?
- Are dependencies logical and validated?
- Does it include appropriate buffer time?
- Is the level of detail maintainable?
- Do you have a baseline for comparison?
- Is it updated at least weekly?
What Are the Best Practices for Effective Construction Schedule Gantt Charts?
Beyond avoiding mistakes, these practices will make your Gantt charts truly useful.
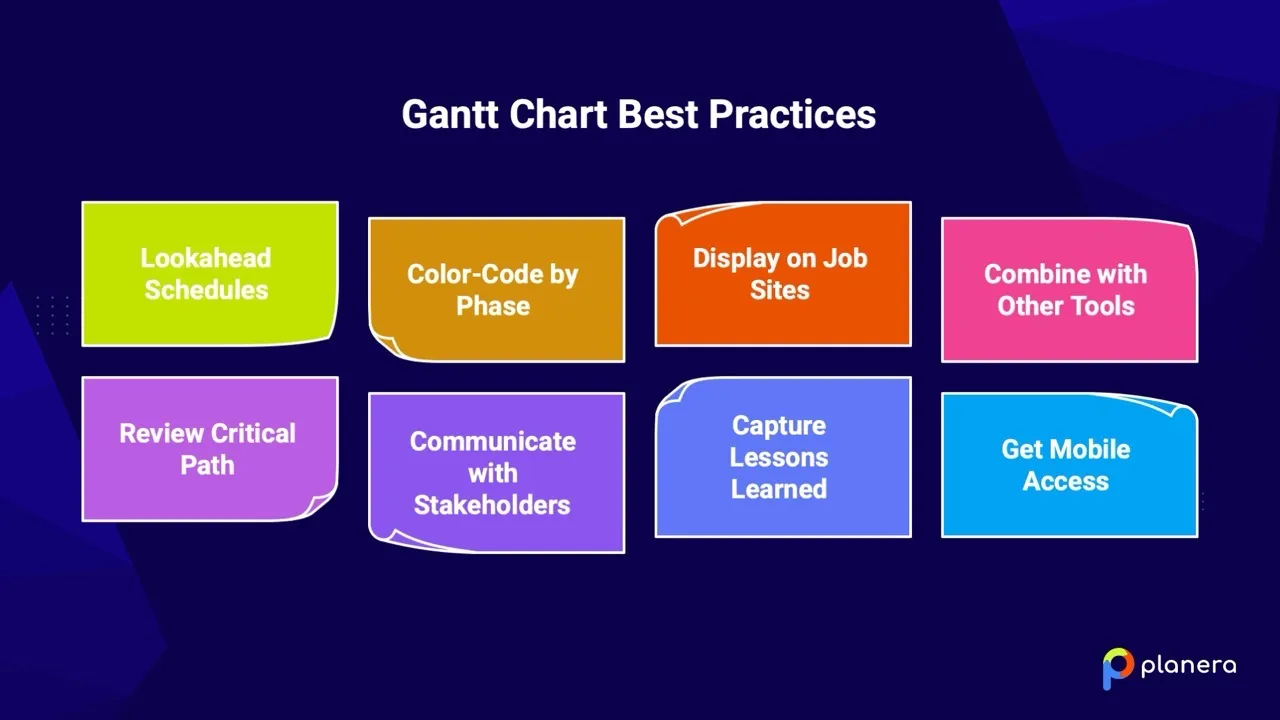
- Use Lookahead Schedules
Planera lets you display the entire project schedule alongside a short-term lookahead, giving teams a clear picture of both long-term timelines and immediate tasks. This helps superintendents and crews focus on what needs attention in the next two to four weeks while keeping the bigger picture in view.
- Color-Code by Phase or Trade
Assign consistent colors to different project phases, trades, or groups. Planera allows you to customize activity colors in the Gantt view, making it easier to scan schedules quickly and see which tasks belong to which phase or team.
- Keep Schedules Accessible on Job Sites
With our cloud-based Gantt charts, field crews can access the schedule from smartphones or tablets, while office teams see the same live updates. This eliminates outdated printed schedules and ensures everyone is working from the same, current information.
- Combine with Other Tools
Planera integrates smoothly with project management workflows. You can combine the Gantt chart with issue tracking, daily logs, and resource allocation to monitor progress, manage problems, and track labor or equipment use in real time.
- Regularly Review Critical Path
Toggle the critical path in Planera to see which tasks directly impact your project completion date. Review critical tasks weekly (or more often during active phases) and adjust non-critical tasks as needed to support timely project delivery.
- Organize Tasks for Maximum Clarity
Use Planera’s grouping and organizational features to sort activities by location, labor, or trade. Collapse or expand groups in the Gantt view to focus on what matters most without losing context. Filters and absolute/relative time views make it easy to analyze and adjust your schedule.
- Capture Lessons Learned
Document why delays happen and compare estimated versus actual task durations. Planera’s scheduling data lets you create a project-specific database of durations, dependencies, and resource use, helping improve future schedule estimates.
- Maintain Real-Time Collaboration
Planera keeps schedules live, so field and office teams can update progress simultaneously. Real-time changes propagate automatically, keeping everyone aligned and eliminating miscommunication.
How to Take Control of Your Project Schedule?
We opened with a tough reality. Most large construction projects run into delays or cost overruns. But those numbers reflect projects where scheduling broke down. It doesn’t have to be how our projects turn out.
Construction schedule Gantt charts have been helping teams deliver successful work for decades. From massive infrastructure builds to modern commercial projects, visual scheduling keeps everyone aligned and focused on what matters most.
Here’s where we see the biggest impact:
- Learn to read Gantt charts fluently.
Once we understand the components, task relationships, and critical path, the schedule stops being a chart and starts telling a story about how the project will actually unfold. - Build schedules together.
Schedules work best when the people doing the work help shape them. When we involve the full team, we get plans that reflect reality, not optimistic assumptions. - Keep schedules current.
A schedule only helps if it matches what’s happening on site. Regular updates keep everyone working from the same information and prevent small issues from turning into major delays. - Protect the critical path.
These tasks control the overall project duration. When we monitor them closely and respond quickly to issues, we protect the entire timeline. - Keep learning from each project.
Tracking actual durations and comparing them to estimates helps us get better over time. Every completed project makes the next schedule more accurate.
The tools may evolve, but clear visualization, team collaboration, and proactive schedule management always matter. Construction scheduling software like Planera are built around these principles, helping teams plan together, spot risks early, and stay aligned as projects change. You can download your Planera Gantt chart as a PDF, complete with your company logo, for client reports, stakeholder updates, or team briefings.
If you’re new to Gantt charts, start simple. Try a smaller project, test a few tools, and build a short lookahead schedule for active work. You’ll often see an immediate improvement in how crews coordinate and execute.
Given how often projects slip without clear planning, the real question isn’t whether better scheduling takes effort. It’s whether we can afford not to do it well.
Ready to see the difference better scheduling can make? Book a demo with us today and get started!
FAQs
How detailed should a construction Gantt chart be?
It should be detailed enough to guide the work, but not so detailed that it’s hard to update. If it takes too long to maintain, it’s too complex. If crews can’t use it to plan their week, it’s too simple.
Who should update the Gantt chart?
One person should be responsible for updates, usually the project manager. But updates should come from the field. Superintendents and subcontractors know what’s really happening on site, so their input matters.
Can Gantt charts work for small projects?
Yes. Even small projects benefit from a clear schedule. When trades overlap, a simple Gantt chart helps prevent missed handoffs and wasted time.
How often should the schedule be reviewed?
At least once a week. During busy or critical phases, daily reviews work best. Regular check-ins help catch problems early.
How do you know if a Gantt chart isn’t working?
If people stop using it. When teams don’t trust the schedule, it’s usually because it’s outdated or unrealistic. A good Gantt chart is one that people check often.
Do you need special software to use Gantt charts?
Not always. Simple projects can use basic tools. For more complex projects, consider using advanced digital solutions like digital construction tools, which integrate various aspects of project management in one platform.
How long does it take to learn how to read a Gantt chart?
Most people pick it up quickly. After a few updates and reviews, it becomes easy to understand. Over time, it turns into a tool the whole team relies on.